It is essential to understand the Hounslow population size and characteristics to effectively plan and deliver healthcare services in the borough.
The following information aims to provide a snapshot of the borough’s residents. For a more detailed data breakdown please visit the Hounslow Data Hub.
Hounslow is the nineteenth largest borough in London and is home to approximately 271,800 residents (2020), the Greater London Authority (GLA) predicts that by 2030 this figure will rise to 288,023 residents. The Hounslow Summary Report | Hounslow | Report Builder for ArcGIS provides a helpful population breakdown on age, ethnicity, birth rates and more.
The GLA projections suggest that post pandemic (2021 onwards), the Hounslow population will continue to grow, although at a slower rate. In the short term, the pandemic is likely to have led to lower international immigration, fewer people moving to London for work or study, and more residents moving out of London, due to the increase of people working from home.
The population is projected to increase by 17% over the period 2020 to 2041. It is estimated that this will lead to an increase of 46,200 residents.
Hounslow has a diverse population 52% of the population from Black, Asian and Minority Ethnic groups according to the Hounslow Health Wellbeing Draft Strategy.pdf.
The two population groups that account for over half of Hounslow’s population are White British and Indian. The borough is also home to a large ‘non-British white’ background population, of which a large proportion are residents who have a Polish background.
Hounslow has a relatively young population: The median age of residents is 36.8 years, which is three years younger than the England average (40.2 years), however slightly older than London’s median age (35.8 years). Women make up 49% of the overall population but 61% of the very elderly population (aged 85 years of age and over).
Between 2011-2020 the median age rose from 33.7 years to 36.8 years. This increase in median age is expected to continue. Between 2020-2041, the number of residents aged 65 and over is projected to increase by 71%, an estimated additional 24,000 older residents. The younger age groups are projected to see minimal growth during this period, increasing by up to 2% in the 0-19 age group.
Data from 2018-2020 evidenced life expectancy for men in the borough at 79.4 years, which is equal to male life expectancy at birth in England, however this is lower than the average for the London region of 80.3 years.
Life expectancy at birth for women in Hounslow is 83.7 years, this is higher than the average for women in England, 83.1 years, but lower than life expectancy for women in the London region, which is 84.3 years.
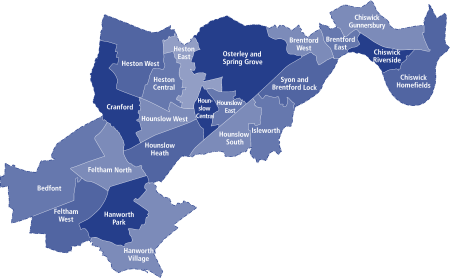
Data from 2015-2019 identified variation in the range of male life expectancy at birth at ward level. Turnham Green reported the highest life expectancy at birth with men living on average until 83.6 years of age, whereas Feltham North had the lowest at 76.9 years. There is a similar picture for female life expectancy at birth with variation by ward in Hounslow, ranging from 88 years of age for women in Osterley and Spring Grove ward to 80 years in Syon ward.
Over 8% of the population living in Hounslow live in the 20% most deprived areas in England. The most deprived area in the borough is the area surrounding the Ivybridge estate in Isleworth, with other small areas with high deprivation in Brentford, Heston West, Cranford, Isleworth, Hanworth and Hanworth Park Wards.
Analysis shows a clear relationship between deprivation levels and obesity levels with more deprived areas of the borough having approximately double the levels of child obesity compared to the less deprived areas
Obesity rates amongst Year 6 children in Hounslow are consistently above the London and England average, with variation in levels of obesity between areas within the borough. Data from 2017/18 to 2019/20 shows that Cranford has the highest obesity prevalence with 29.2% of Year 6 children being obese compared to Chiswick Riverside with the lowest prevalence at 13%. We know that obesity is associated with higher rates of long-term conditions and other poor health outcomes.
In Hounslow, 11.1% of households are fuel poor (2022). Whilst this is lower than London (11.5%) and England (13.2%) there is variation of fuel poverty levels within the borough.
The wards with the highest proportion of households that are fuel poor are Hounslow Central (14.3%), Hanworth (13.6%), Hounslow West (13.1%) and Cranford (13%). Wards with the lowest proportion of households that are fuel poor are Chiswick Homefields (6.4%), Turnham Green (6.9%) and Chiswick Riverside (7.2%).
Fuel poverty is likely to rise within the borough due to increased cost of energy, which could lead to increased rates of illness and premature deaths.

To view the Hounslow Health and Wellbeing Strategy 2022 – 25 please visit - Hounslow Health Wellbeing Draft Strategy.pdf. This provides a full breakdown of the borough, and the action plan that is being delivered to provide more positive outcomes for residents.
You can also find more information about Hounslow’s population by visiting Hounslow’s Data Hub.