The Hounslow digital dashboard provides live monthly activity data on hospital admissions for:
- Dementia
- Children and Young People
- Emergency
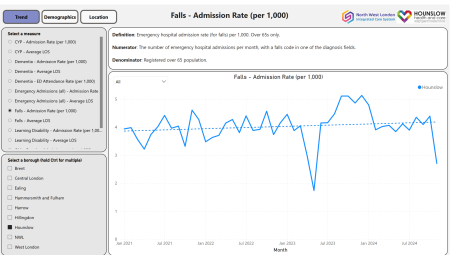
- Falls
- Learning and Disabilities
- Older people
The dashboards provide direct comparisons to be made, as they can segmented by PCN, ethnicity or borough etc. The dashboard data can also be sorted via trend, demographic, or location tabs.
Trend
- Services can track activity on a monthly basis, users simply filter dates to a specific timeframe and data is available to review immediately. Additionally, trend lines provide a clear and simple indication as to whether activity rates are increasing or decreasing, and a what rate.
- It is also possible to select multiple boroughs, allowing benchmarking between Hounslow and other NWL boroughs.
Demographics
- This allows services to gain an understanding into the make-up of their patient cohort – for example which groups are experiencing higher or lower rates (outliers); presented by ethnicity, deprivation score, age band and sex.
- It is also possible to compare these groups of patients between each NWL borough.
Location
- This allows services to view activity rates at PCN, level, and it is also possible to compare rates at Practice level, or via a more detailed heat map (which splits the Hounslow borough at LSOA level).
The dashboard is fully compliant with WSIC IG guidelines. Where smaller data segments are concerned (data sourced from WSIC cannot be presented at patient level)
Data is refreshed on a monthly basis and can be accessed via the BBP website, Hounslow data dashboard.
Further Developments
If services are keen to add specific/tailored measures, please contact michael.